


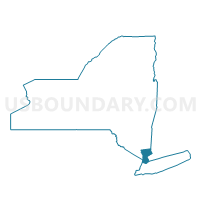
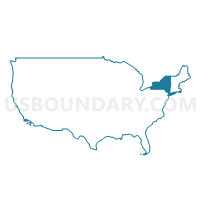
Westchester County, New York
About
Outline

Summary
| Unique Area Identifier | 119984 |
| Name | Westchester County |
| State | New York |
| Area (square miles) | 500.00 |
| Land Area (square miles) | 430.50 |
| Water Area (square miles) | 69.50 |
| % of Land Area | 86.10 |
| % of Water Area | 13.90 |
| Latitude of the Internal Point | 41.15276980 |
| Longtitude of the Internal Point | -73.74591200 |
| Total Population | 949,113 |
| Total Housing Units | 370,821 |
| Total Households | 347,232 |
| Median Age | 40 |
Maps
Graphs
Select a template below for downloading or customizing gragh for Westchester County, New York


Neighbors
Neighoring County (by Name) Neighboring County on the Map
- Bergen County, NJ
- Bronx County, NY
- Fairfield County, CT
- Nassau County, NY
- Putnam County, NY
- Rockland County, NY
County Subdivision in Westchester County (by Name) Neighboring County Subdivision on the Map
- Bedford town, Westchester County, NY
- Cortlandt town, Westchester County, NY
- Eastchester town, Westchester County, NY
- Greenburgh town, Westchester County, NY
- Harrison town, Westchester County, NY
- Lewisboro town, Westchester County, NY
- Mamaroneck town, Westchester County, NY
- Mount Kisco town, Westchester County, NY
- Mount Pleasant town, Westchester County, NY
- Mount Vernon city, Westchester County, NY
- New Castle town, Westchester County, NY
- New Rochelle city, Westchester County, NY
- North Castle town, Westchester County, NY
- North Salem town, Westchester County, NY
- Ossining town, Westchester County, NY
- Peekskill city, Westchester County, NY
- Pelham town, Westchester County, NY
- Pound Ridge town, Westchester County, NY
- Rye town, Westchester County, NY
- Rye city, Westchester County, NY
- Scarsdale town, Westchester County, NY
- Somers town, Westchester County, NY
- White Plains city, Westchester County, NY
- Yonkers city, Westchester County, NY
- Yorktown town, Westchester County, NY
Top 10 Neighboring Place (by Population) Neighboring Place on the Map
- New York city, NY (8,175,133)
- Yonkers city, NY (195,976)
- Stamford city, CT (122,643)
- New Rochelle city, NY (77,062)
- Mount Vernon city, NY (67,292)
- White Plains city, NY (56,853)
- Port Chester village, NY (28,967)
- Harrison village, NY (27,472)
- Glen Cove city, NY (26,964)
- Ossining village, NY (25,060)
Top 10 Neighboring Elementary School District (by Population) Neighboring Elementary School District on the Map
Top 10 Neighboring Unified School District (by Population) Neighboring Unified School District on the Map
- New York City Department Of Education, NY (8,175,133)
- Yonkers City School District, NY (195,976)
- Stamford School District, CT (122,643)
- New Rochelle City School District, NY (77,062)
- Mount Vernon City School District, NY (67,292)
- Greenwich School District, CT (61,171)
- White Plains City School District, NY (56,853)
- Clarkstown Central School District, NY (48,526)
- Haverstraw-Stony Point Central School District, NY (47,775)
- Lakeland Central School District, NY (35,349)
Top 10 Neighboring State Legislative District Lower Chamber (by Population) Neighboring State Legislative District Lower Chamber on the Map
- General Assembly District 39, NJ (217,041)
- Assembly District 95, NY (145,915)
- Assembly District 96, NY (138,725)
- Assembly District 90, NY (137,827)
- Assembly District 94, NY (135,492)
- Assembly District 99, NY (134,814)
- Assembly District 16, NY (134,747)
- Assembly District 92, NY (133,416)
- Assembly District 87, NY (132,139)
- Assembly District 13, NY (131,694)
Top 10 Neighboring State Legislative District Upper Chamber (by Population) Neighboring State Legislative District Upper Chamber on the Map
- State Senate District 38, NY (347,376)
- State Senate District 36, NY (328,256)
- State Senate District 37, NY (326,645)
- State Senate District 5, NY (316,844)
- State Senate District 40, NY (316,324)
- State Senate District 34, NY (315,408)
- State Senate District 35, NY (313,382)
- State Senate District 7, NY (311,141)
- State Senate District 31, NY (292,157)
- State Senate District 39, NJ (217,041)
Top 10 Neighboring 111th Congressional District (by Population) Neighboring 111th Congressional District on the Map
- Congressional District 4, CT (706,740)
- Congressional District 19, NY (699,959)
- Congressional District 17, NY (678,558)
- Congressional District 18, NY (674,825)
- Congressional District 5, NY (670,130)
- Congressional District 7, NY (667,632)
- Congressional District 5, NJ (666,551)
- Congressional District 3, NY (645,508)
Top 10 Census Tract in Westchester County (by Population) Neighboring Census Tract on the Map
- Census Tract 148.04, Westchester County, NY (8,021)
- Census Tract 79, Westchester County, NY (7,930)
- Census Tract 2.01, Westchester County, NY (7,669)
- Census Tract 92, Westchester County, NY (7,065)
- Census Tract 122, Westchester County, NY (7,019)
- Census Tract 6, Westchester County, NY (6,977)
- Census Tract 105, Westchester County, NY (6,959)
- Census Tract 82, Westchester County, NY (6,931)
- Census Tract 128.02, Westchester County, NY (6,899)
- Census Tract 116, Westchester County, NY (6,848)
Top 10 Neighboring 5-Digit ZIP Code Tabulation Area (by Population) Neighboring 5-Digit ZIP Code Tabulation Area on the Map
- 10467, NY (97,060)
- 10466, NY (67,813)
- 10701, NY (63,393)
- 10475, NY (40,931)
- 10801, NY (40,827)
- 10583, NY (38,982)
- 10705, NY (38,777)
- 10573, NY (38,352)
- 10550, NY (37,144)
- 10562, NY (31,796)
Data
Demographic, Population, Households, and Housing Units
** Data sources from census 2010 **
Show Data on Map
Download Full List as CSV
Download Quick Sheet as CSV
| Subject | This Area | New York | National |
|---|---|---|---|
| POPULATION | |||
| Total Population Map | 949,113 | 19,378,102 | 308,745,538 |
| POPULATION, HISPANIC OR LATINO ORIGIN | |||
| Not Hispanic or Latino Map | 742,081 | 15,961,180 | 258,267,944 |
| Hispanic or Latino Map | 207,032 | 3,416,922 | 50,477,594 |
| POPULATION, RACE | |||
| White alone Map | 646,471 | 12,740,974 | 223,553,265 |
| Black or African American alone Map | 138,118 | 3,073,800 | 38,929,319 |
| American Indian and Alaska Native alone Map | 3,965 | 106,906 | 2,932,248 |
| Asian alone Map | 51,716 | 1,420,244 | 14,674,252 |
| Native Hawaiian and Other Pacific Islander alone Map | 387 | 8,766 | 540,013 |
| Some Other Race alone Map | 78,503 | 1,441,563 | 19,107,368 |
| Two or More Races Map | 29,953 | 585,849 | 9,009,073 |
| POPULATION, SEX | |||
| Male Map | 456,661 | 9,377,147 | 151,781,326 |
| Female Map | 492,452 | 10,000,955 | 156,964,212 |
| POPULATION, AGE (18 YEARS) | |||
| 18 years and over Map | 721,113 | 15,053,173 | 234,564,071 |
| Under 18 years | 228,000 | 4,324,929 | 74,181,467 |
| POPULATION, AGE | |||
| Under 5 years | 57,199 | 1,155,822 | 20,201,362 |
| 5 to 9 years | 63,212 | 1,163,955 | 20,348,657 |
| 10 to 14 years | 65,680 | 1,211,456 | 20,677,194 |
| 15 to 17 years | 41,909 | 793,696 | 12,954,254 |
| 18 and 19 years | 23,407 | 572,582 | 9,086,089 |
| 20 years | 10,712 | 293,083 | 4,519,129 |
| 21 years | 10,528 | 281,596 | 4,354,294 |
| 22 to 24 years | 32,340 | 836,256 | 12,712,576 |
| 25 to 29 years | 52,654 | 1,380,177 | 21,101,849 |
| 30 to 34 years | 55,359 | 1,279,160 | 19,962,099 |
| 35 to 39 years | 61,723 | 1,254,124 | 20,179,642 |
| 40 to 44 years | 71,261 | 1,355,893 | 20,890,964 |
| 45 to 49 years | 76,241 | 1,458,763 | 22,708,591 |
| 50 to 54 years | 72,791 | 1,419,928 | 22,298,125 |
| 55 to 59 years | 61,788 | 1,237,408 | 19,664,805 |
| 60 and 61 years | 22,593 | 453,993 | 7,113,727 |
| 62 to 64 years | 30,594 | 612,267 | 9,704,197 |
| 65 and 66 years | 16,549 | 330,160 | 5,319,902 |
| 67 to 69 years | 22,456 | 443,051 | 7,115,361 |
| 70 to 74 years | 29,761 | 587,391 | 9,278,166 |
| 75 to 79 years | 25,429 | 474,807 | 7,317,795 |
| 80 to 84 years | 22,200 | 391,660 | 5,743,327 |
| 85 years and over | 22,727 | 390,874 | 5,493,433 |
| MEDIAN AGE BY SEX | |||
| Both sexes Map | 40.00 | 38.00 | 37.20 |
| Male Map | 38.30 | 36.30 | 35.80 |
| Female Map | 41.50 | 39.40 | 38.50 |
| HOUSEHOLDS | |||
| Total Households Map | 347,232 | 7,317,755 | 116,716,292 |
| HOUSEHOLDS, HOUSEHOLD TYPE | |||
| Family households: Map | 236,419 | 4,649,791 | 77,538,296 |
| Husband-wife family Map | 177,077 | 3,192,903 | 56,510,377 |
| Other family: Map | 59,342 | 1,456,888 | 21,027,919 |
| Male householder, no wife present Map | 14,855 | 366,948 | 5,777,570 |
| Female householder, no husband present Map | 44,487 | 1,089,940 | 15,250,349 |
| Nonfamily households: Map | 110,813 | 2,667,964 | 39,177,996 |
| Householder living alone Map | 94,614 | 2,130,670 | 31,204,909 |
| Householder not living alone Map | 16,199 | 537,294 | 7,973,087 |
| HOUSEHOLDS, HISPANIC OR LATINO ORIGIN OF HOUSEHOLDER | |||
| Not Hispanic or Latino householder: Map | 290,466 | 6,311,241 | 103,254,926 |
| Hispanic or Latino householder: Map | 56,766 | 1,006,514 | 13,461,366 |
| HOUSEHOLDS, RACE OF HOUSEHOLDER | |||
| Householder who is White alone | 250,538 | 5,169,163 | 89,754,352 |
| Householder who is Black or African American alone | 50,671 | 1,095,790 | 14,129,983 |
| Householder who is American Indian and Alaska Native alone | 1,143 | 33,824 | 939,707 |
| Householder who is Asian alone | 16,257 | 445,652 | 4,632,164 |
| Householder who is Native Hawaiian and Other Pacific Islander alone | 118 | 2,615 | 143,932 |
| Householder who is Some Other Race alone | 20,723 | 405,320 | 4,916,427 |
| Householder who is Two or More Races | 7,782 | 165,391 | 2,199,727 |
| HOUSEHOLDS, HOUSEHOLD TYPE BY HOUSEHOLD SIZE | |||
| Family households: Map | 236,419 | 4,649,791 | 77,538,296 |
| 2-person household Map | 85,912 | 1,785,206 | 31,882,616 |
| 3-person household Map | 55,798 | 1,109,716 | 17,765,829 |
| 4-person household Map | 53,637 | 944,590 | 15,214,075 |
| 5-person household Map | 25,393 | 461,667 | 7,411,997 |
| 6-person household Map | 9,290 | 189,577 | 3,026,278 |
| 7-or-more-person household Map | 6,389 | 159,035 | 2,237,501 |
| Nonfamily households: Map | 110,813 | 2,667,964 | 39,177,996 |
| 1-person household Map | 94,614 | 2,130,670 | 31,204,909 |
| 2-person household Map | 13,136 | 430,564 | 6,360,012 |
| 3-person household Map | 1,630 | 66,787 | 992,156 |
| 4-person household Map | 759 | 24,877 | 411,171 |
| 5-person household Map | 328 | 8,596 | 126,634 |
| 6-person household Map | 194 | 3,400 | 48,421 |
| 7-or-more-person household Map | 152 | 3,070 | 34,693 |
| HOUSING UNITS | |||
| Total Housing Units Map | 370,821 | 8,108,103 | 131,704,730 |
| HOUSING UNITS, OCCUPANCY STATUS | |||
| Occupied Map | 347,232 | 7,317,755 | 116,716,292 |
| Vacant Map | 23,589 | 790,348 | 14,988,438 |
| HOUSING UNITS, OCCUPIED, TENURE | |||
| Owned with a mortgage or a loan Map | 149,162 | 2,610,123 | 52,979,430 |
| Owned free and clear Map | 64,726 | 1,287,714 | 23,006,644 |
| Renter occupied Map | 133,344 | 3,419,918 | 40,730,218 |
| HOUSING UNITS, VACANT, VACANCY STATUS | |||
| For rent Map | 7,813 | 200,039 | 4,137,567 |
| Rented, not occupied Map | 422 | 12,786 | 206,825 |
| For sale only Map | 3,757 | 77,225 | 1,896,796 |
| Sold, not occupied Map | 837 | 21,027 | 421,032 |
| For seasonal, recreational, or occasional use Map | 3,355 | 289,301 | 4,649,298 |
| For migrant workers Map | 3 | 892 | 24,161 |
| Other vacant Map | 7,402 | 189,078 | 3,652,759 |
| HOUSING UNITS, OCCUPIED, AVERAGE HOUSEHOLD SIZE BY TENURE | |||
| Total: Map | 2.65 | 2.57 | 2.58 |
| Owner occupied Map | 2.73 | 2.71 | 2.65 |
| Renter occupied Map | 2.52 | 2.41 | 2.44 |
| HOUSING UNITS, OCCUPIED, TENURE BY RACE OF HOUSEHOLDER | |||
| Owner occupied: Map | 213,888 | 3,897,837 | 75,986,074 |
| Householder who is White alone Map | 178,054 | 3,237,592 | 63,446,275 |
| Householder who is Black or African American alone Map | 17,814 | 325,395 | 6,261,464 |
| Householder who is American Indian and Alaska Native alone Map | 306 | 11,250 | 509,588 |
| Householder who is Asian alone Map | 9,962 | 197,011 | 2,688,861 |
| Householder who is Native Hawaiian and Other Pacific Islander alone Map | 42 | 741 | 61,911 |
| Householder who is Some Other Race alone Map | 4,911 | 74,243 | 1,975,817 |
| Householder who is Two or More Races Map | 2,799 | 51,605 | 1,042,158 |
| Renter occupied: Map | 133,344 | 3,419,918 | 40,730,218 |
| Householder who is White alone Map | 72,484 | 1,931,571 | 26,308,077 |
| Householder who is Black or African American alone Map | 32,857 | 770,395 | 7,868,519 |
| Householder who is American Indian and Alaska Native alone Map | 837 | 22,574 | 430,119 |
| Householder who is Asian alone Map | 6,295 | 248,641 | 1,943,303 |
| Householder who is Native Hawaiian and Other Pacific Islander alone Map | 76 | 1,874 | 82,021 |
| Householder who is Some Other Race alone Map | 15,812 | 331,077 | 2,940,610 |
| Householder who is Two or More Races Map | 4,983 | 113,786 | 1,157,569 |
| HOUSING UNITS, OCCUPIED, TENURE BY HISPANIC OR LATINO ORIGIN OF HOUSEHOLDER | |||
| Owner occupied: Map | 213,888 | 3,897,837 | 75,986,074 |
| Not Hispanic or Latino householder Map | 196,398 | 3,664,784 | 69,617,625 |
| Hispanic or Latino householder Map | 17,490 | 233,053 | 6,368,449 |
| Renter occupied: Map | 133,344 | 3,419,918 | 40,730,218 |
| Not Hispanic or Latino householder Map | 94,068 | 2,646,457 | 33,637,301 |
| Hispanic or Latino householder Map | 39,276 | 773,461 | 7,092,917 |
| HOUSING UNITS, OCCUPIED, TENURE BY HOUSEHOLD SIZE | |||
| Owner occupied: Map | 213,888 | 3,897,837 | 75,986,074 |
| 1-person household Map | 47,613 | 860,611 | 16,453,569 |
| 2-person household Map | 66,390 | 1,304,752 | 27,618,605 |
| 3-person household Map | 36,429 | 660,251 | 12,517,563 |
| 4-person household Map | 37,684 | 606,580 | 10,998,793 |
| 5-person household Map | 17,064 | 279,929 | 5,057,765 |
| 6-person household Map | 5,546 | 106,323 | 1,965,796 |
| 7-or-more-person household Map | 3,162 | 79,391 | 1,373,983 |
| Renter occupied: Map | 133,344 | 3,419,918 | 40,730,218 |
| 1-person household Map | 47,001 | 1,270,059 | 14,751,340 |
| 2-person household Map | 32,658 | 911,018 | 10,624,023 |
| 3-person household Map | 20,999 | 516,252 | 6,240,422 |
| 4-person household Map | 16,712 | 362,887 | 4,626,453 |
| 5-person household Map | 8,657 | 190,334 | 2,480,866 |
| 6-person household Map | 3,938 | 86,654 | 1,108,903 |
| 7-or-more-person household Map | 3,379 | 82,714 | 898,211 |
Loading...